2024.03.14
How to use ViewTurbo on PC?
The PC usage guide for ViewTurbo, where you can find some common questions related to PC.Video Tutorial
Encountered an error? Try YouTube
First Launch, macOS only
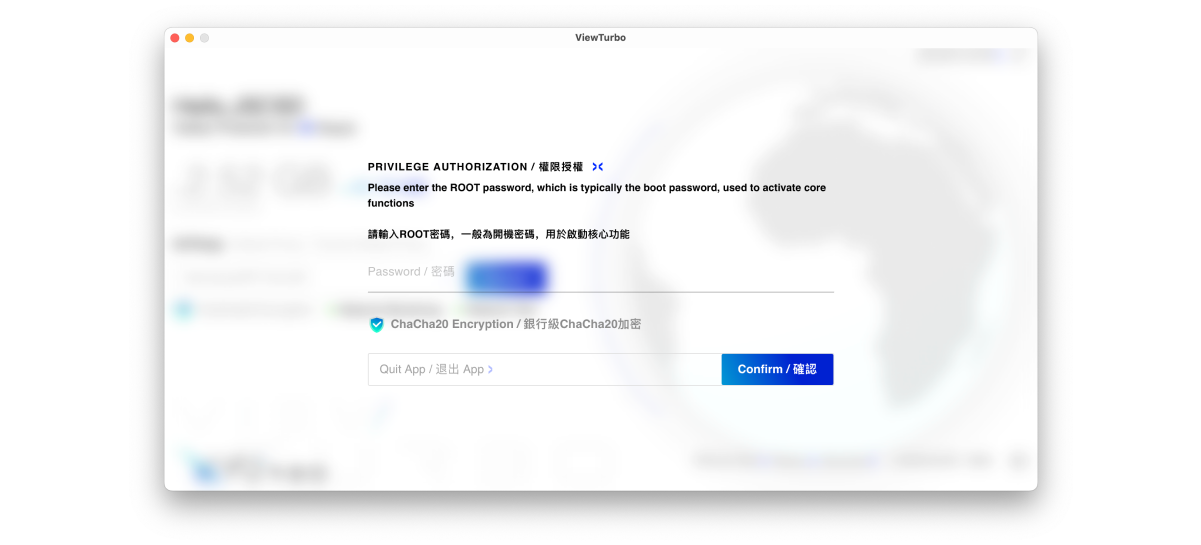
When you start for the first time, this permissions page will appear. This is to enable our system-level proxy and does not compromise your privacy or security. Usually, you only need to enter your startup password in the "Password / 密碼" field, then click "Confirm / 確認"
Select your current country or region
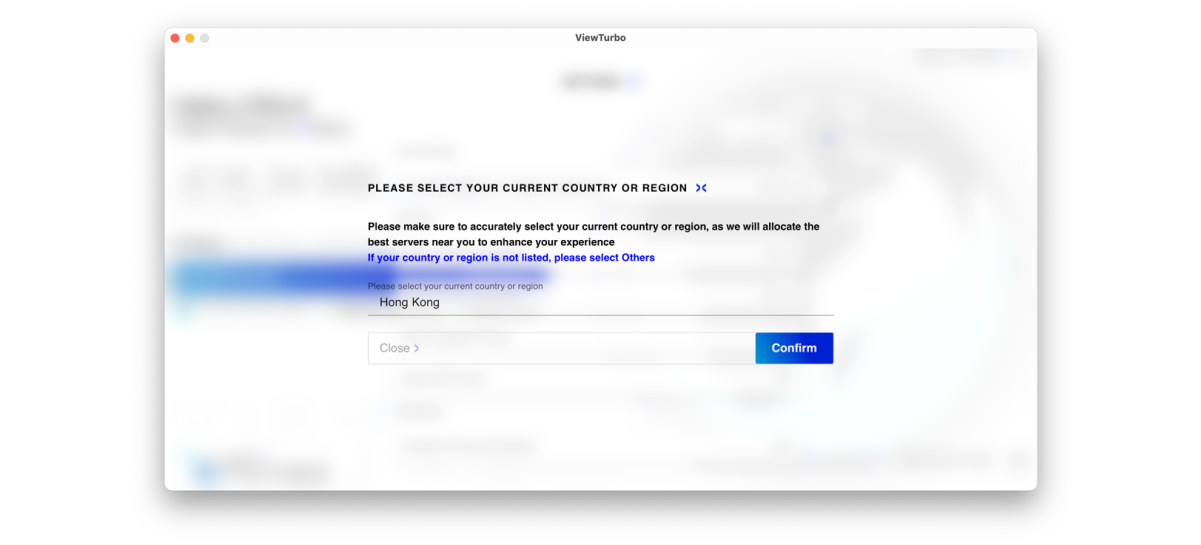
If you're selecting a node for the first time, a prompt will appear to select your country. This selection enables our AI Proxy technology to adaptively provide proxy services tailored to your country and region, specifically targeting certain websites and transmissions.
If you move to a new country, there's no issue—simply click the gear icon  in the bottom right corner of the main page to access "Current Country or Region Selection" then click "Select" to make a new choice.
If you prefer not to select an option, you can simply click  to close this window. If your country or region isn't listed, you can select "Others"
Proxy
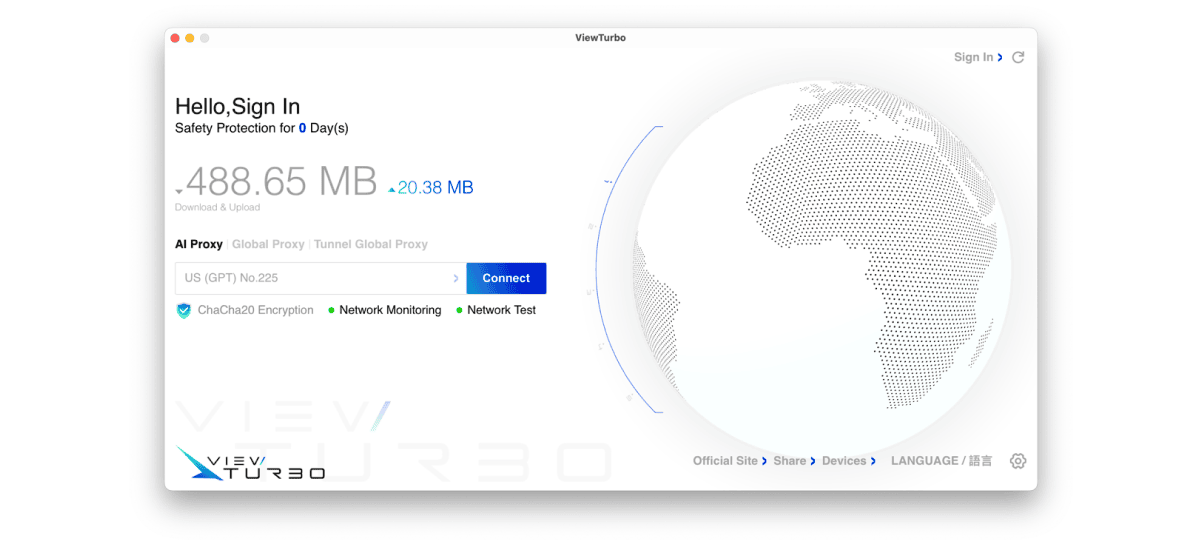
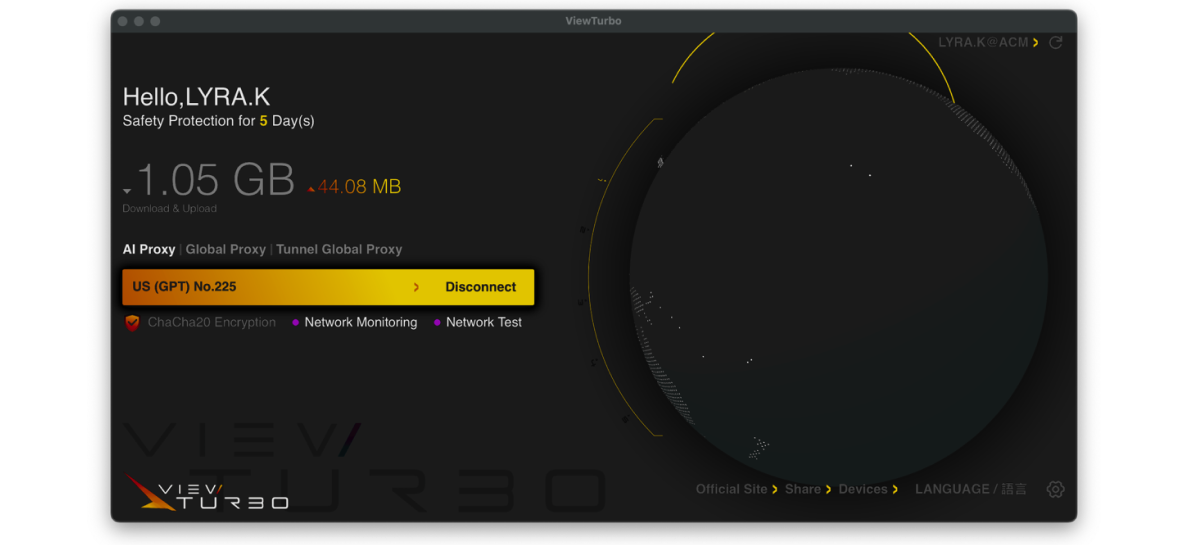
The usage of macOS and Windows systems is quite similar, with no significant differences. If you haven't registered an account yet, you need to click "Sign In" and then click "No Account? Sign Up" to register.
Proxy options:
- AI Proxy: Automatically configures whether to use a proxy based on your country and region. You can also make changes through the small gear icon
 in the bottom right corner. We recommend using this mode
 - Global Proxy: After enabling the global proxy, all applications and network requests (such as web browsing and software updates) will be processed through the specified proxy server.
- Tunnel Global Proxy: Proxies all traffic through an encrypted tunnel, providing higher security.
Select Node
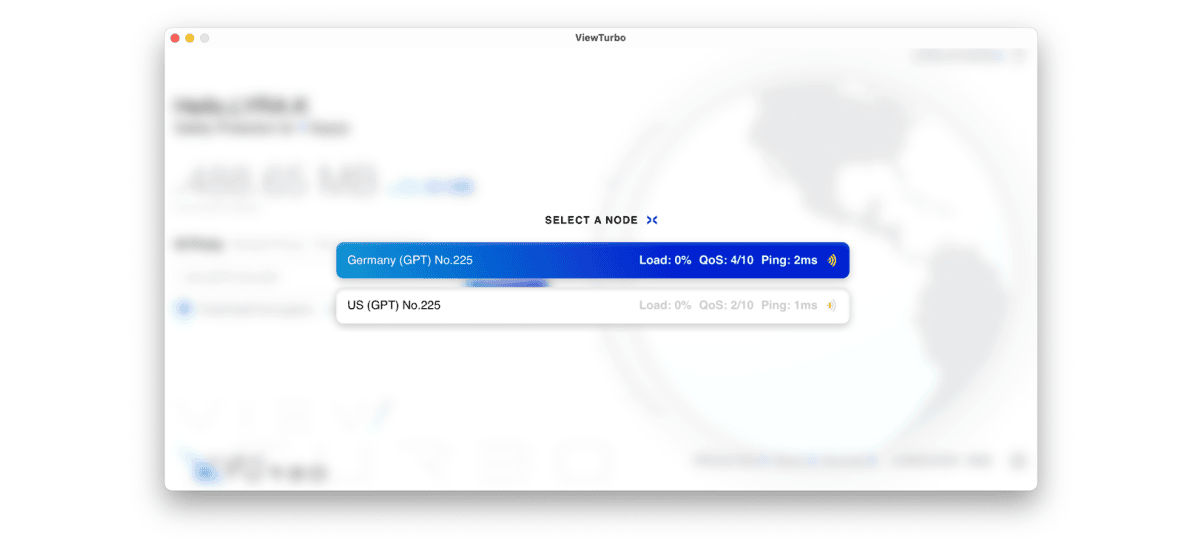
When we click on the node area, specifically where it displays "US (GPT) No.225", the "Select a node"  window will appear, allowing us to choose a node. Alternatively, you can click in the blank area to close it. After selecting a node, you can click "Connect"to establish a connection.
After connecting, you can click "Network Test" under Connect to test the speed of the node.
- Load: This indicates the load on the server, which shows how many users are connected.
- QoS: This stands for Quality of Service, which reflects the network quality of the server, with a maximum score of 10.
- Ping: This refers to network latency and is often referenced alongside QoS to assess the server's performance index.
User Info
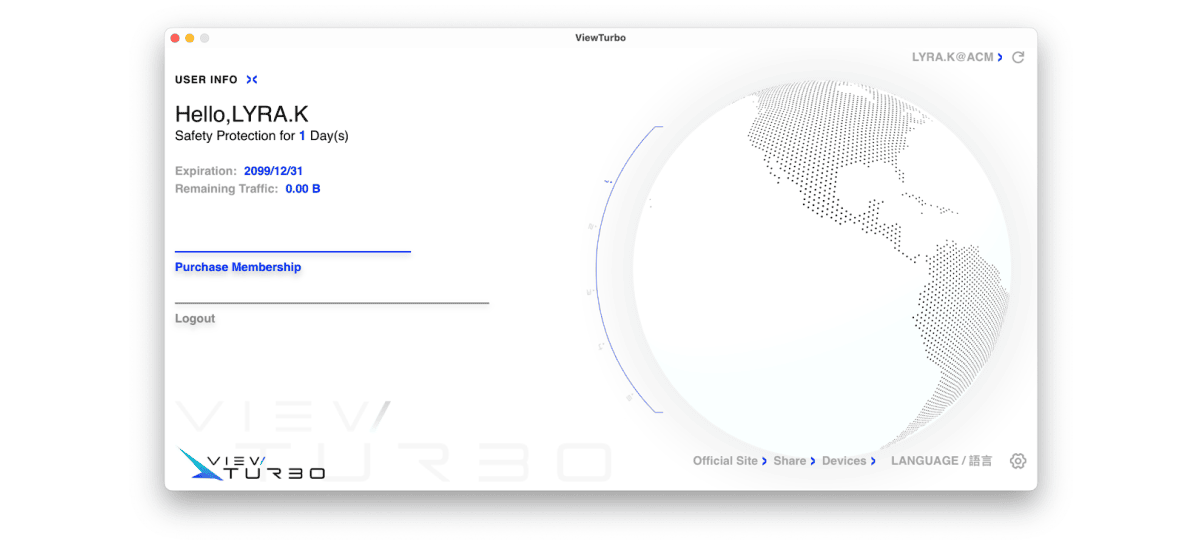
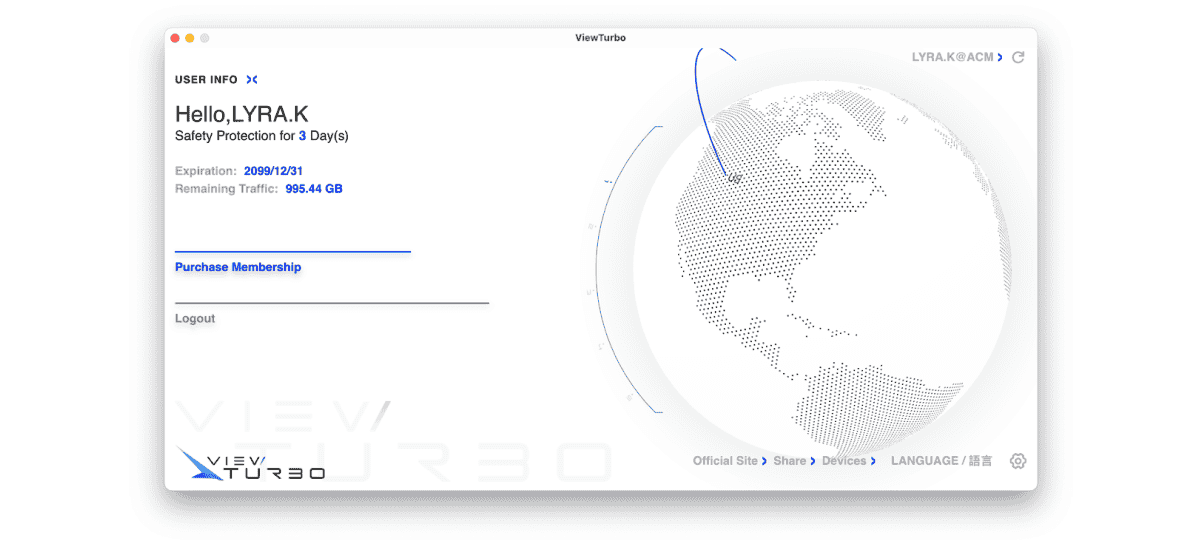
In the logged-in state, clicking on the username in the upper right corner allows you to view user information. If you are not logged in, clicking "Sign in" will take you to the login page. You can click "USER INFO" in the upper left corner to return to the main interface.
- Expiration: This indicates the type of account. If it shows 2099/12/31, you are a traffic user. If it specifies a deadline, you are a duration user. You can check our plans at Charge.
- Remaining Traffic: This shows the remaining traffic information. If it reads 0.00 B, you cannot use the acceleration feature and need to recharge your traffic. If you top up membership, it will show 9999GB.
- Purchase Membership: Redirects to our Charge page to purchase duration or traffic.
- Logout: Logs out of the current account.
Refresh Information
If your information hasn't updated after a recharge, don't worry. You can click the refresh  button next to your username at the top to get the latest information. This will refresh:
- User Information: Updates old cached data with the latest info.
- Node Information: Refreshes to show the latest nodes, though these are typically up-to-date when you start.
- Configuration Information: Updates your settings configurations.
Network Monitoring
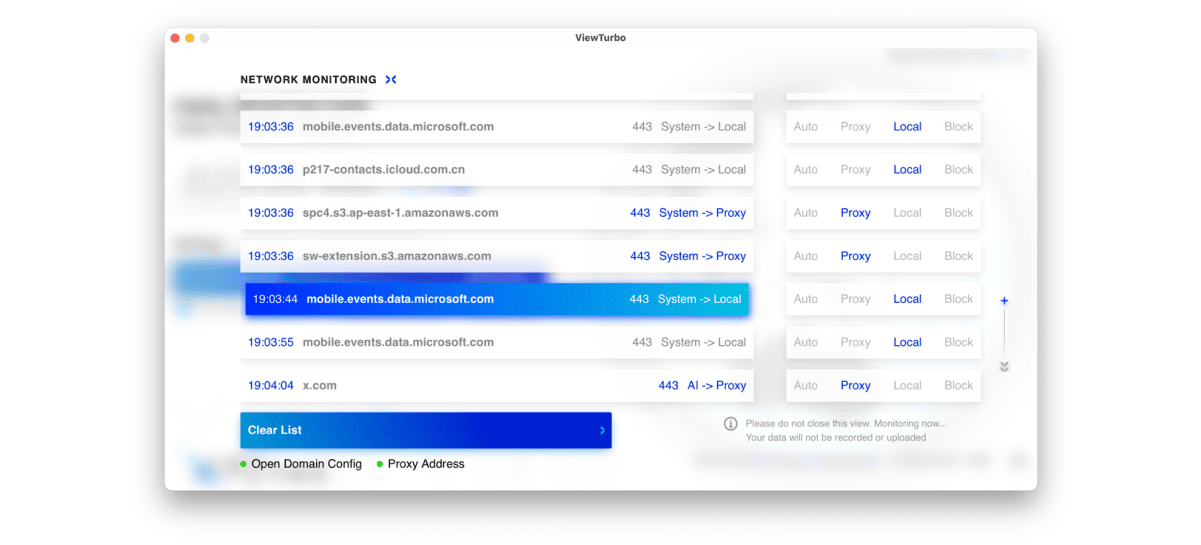
To access this feature, open "Network Monitoring" in the main interface. After that, when you open a page or the system generates network traffic automatically, it will be displayed there.
If you want to close this interface, you can click "NETWORK MONITORING"  in the upper left corner to close it.
What is Auto, Proxy, Local, Block?
- Auto: Determines whether to use a proxy based on the server's response speed to the target address;
- Proxy: Access via proxy;
- Local: Access without using a proxy, using the local network;
- Block: Prevents this server from sending data to me;
Open Domain Config
tip
You'll never guess—some of our files actually support regex domain matching. Surprising, right?
- user_block.txt: Customize domains to block from using the proxy.
- user_local.txt: Customize domains to access via the local network without using a proxy.
- user_proxy.txt: Customize domains to access via a proxy.
- config.ini: Some configurations for ViewTurbo.
- Country.mmdb: GeoIP database used to store geographical information for automatic proxying via ViewTurbo.
- sys_local.txt and sys_proxy.txt: These are stored in an encrypted format and contain essential system status and proxy server information.
- user_block.txt: Customize domains to block from using the proxy.
- user_local.txt: Customize domains to access via the local network without using a proxy.
- user_proxy.txt: Customize domains to access via a proxy.
Proxy address
It contains the addresses of HTTP and SOCKS5 proxies:
- HTTP: 127.0.0.1:15732
- SOCKS5: 127.0.0.1:15733
View Devices
Support for Ten Devices
Our proxy service allows connection for up to 10 devices, including two for Linux, two for Windows, two for Apple, two for macOS, and two for Android, providing flexible cross-platform compatibility.
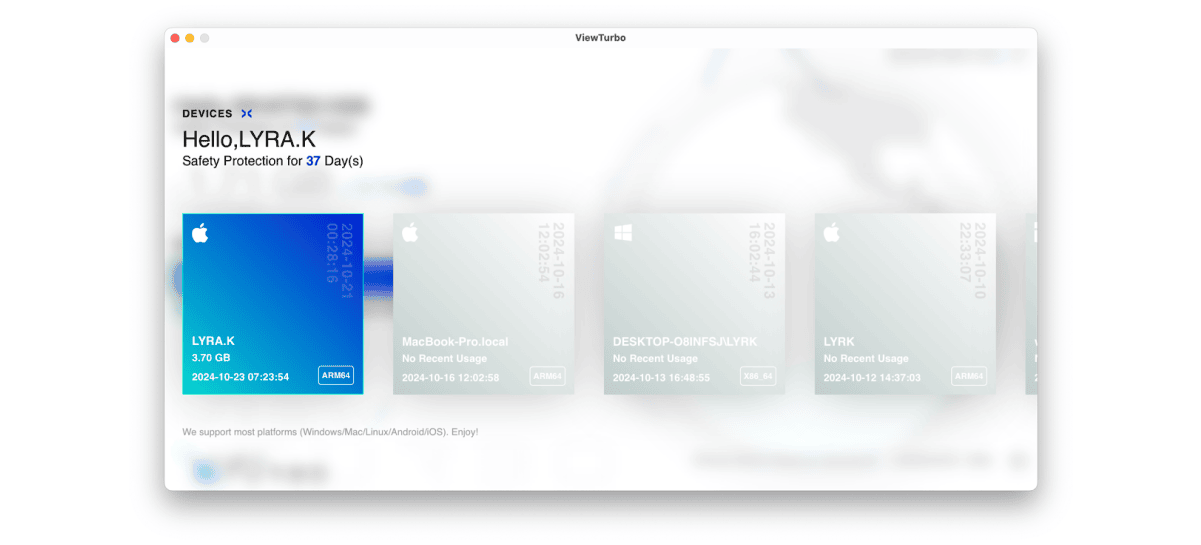
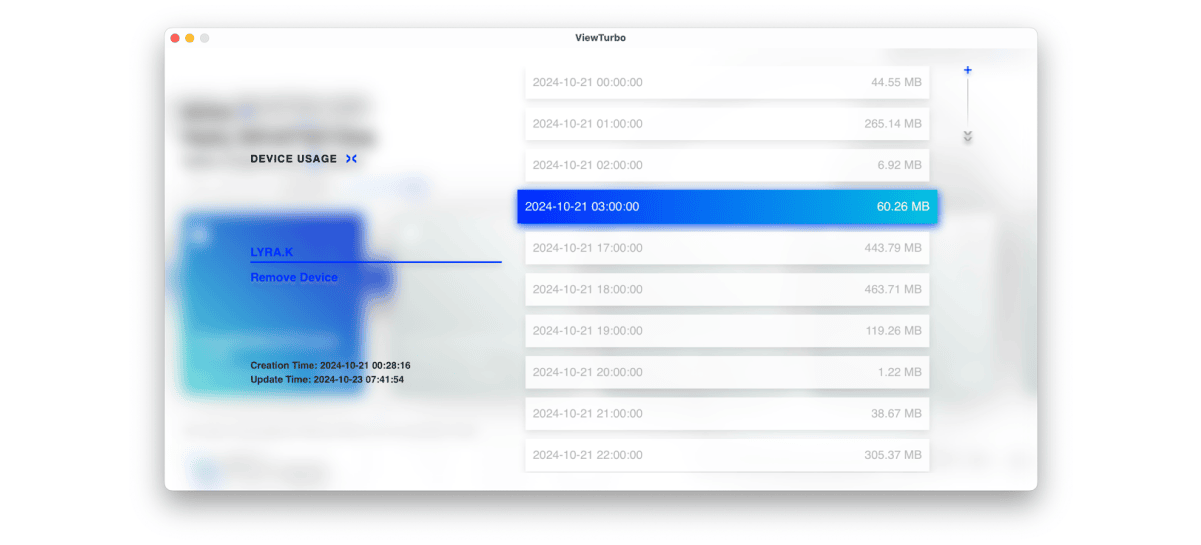
Given the number of connected devices, effective device management becomes crucial. In the main interface under the "Devices" tab, you can view all previously connected devices. When you hover your cursor over a device, detailed information will be displayed.
Security
We implement Device Segmentation to isolate traffic between devices. This ensures that even if one device is compromised, attackers will not be able to easily infiltrate other devices connected through ViewTurbo.
Device Logging and Monitoring Controls
When you select a device, a window will pop up showing specific details, such as the device's login time and the last time it was used. If the device has used any data, it will be displayed on the right-hand side. If the device only logged in but didn't use any data, no traffic usage will be recorded.
If you wish to remove a device's login or log out an account from a particular device, you can click the "Remove Device" button located below the device information.
If you want to close this window, you can click "DEVICE USAGE"  to close it.
- Remove Device: Logs out the account from the device and immediately disconnects it from the network.
- Creation Time: The timestamp of when the device first logged into the account.
- Update Time: The most recent time the device was active.
Dark Mode Support
tip
Currently, we support automatic switching to dark mode based on your system's night mode settings. Here's how to enable night mode on Windows and macOS:
Windows: Enable Night Mode in Windows
macOS: Enable Dark Mode in macOS
Surprise! We do support dark mode. However, it requires your system to be set to dark or night mode. Switching methods vary by system: for example, Windows allows you to set specific times for night mode, while macOS can switch to dark mode by default based on your preferences.

